arrow_left
arrow_right


I build Search & Graphing products at Datadog. I also teach at CUNY Graduate Center. Before: I studied design at Parsons, built healthcare products at Arcadia, and studied engineering at Brown. I live in Queens, New York.
As a Staff Product Manager of Investigation and Search at Datadog, I work on enabling users to find answers in complex systems.
My initial focus was Data Visualization and Querying: creating more expressive data analysis tools. In parallel, I studied how customers move through an investigation. As my understanding in this space matured in my first year at Datadog, I developed a vision for how to automate investigation.
In year two, I conceived and shipped Datadog’s first widely used AI feature, Watchdog Explains. In near-realtime, this feature automatically detects anomalies on dashboards, and picks apart the exact dimension contributing to the anomaly. The feature was a good start for automating investigation: it's efficient enough to run for free, and shows few false positives.
My focus now is moving beyond triage to automating root cause analysis. I’m working through challenges like: how do we proactively scan for issues without incurring too much cost at Datadog’s scale? How do we take advantage of an LLM’s creativity while ensuring it returns quick and accurate results? And how do we bring in the user's expertise without making them do too much work?
My team has expanded to include Search, in order to build context layers and semantic search models to ground an LLM in its investigation. We are working on building a multi-layered investigation system that takes multiple, gradually more comprehensive passes at detecting an issue.
I teach Creative Computing at CUNY Graduate Center, where grad students learn to use code for creative expression. I love seeing students discover what becomes possible with code.
After years of building interactive art with code outside of work, I wanted to push my practice further. I went to Parsons Design School to study computational design and data visualization.
My thesis at Parsons, How We Gaze, was a gallery of gazes: it distorts art to reflect how the viewer looks at it in realtime. How We Gaze was selected as a winner for the Pudding Cup, an independent data visualization award. Snippets of this project and others below.
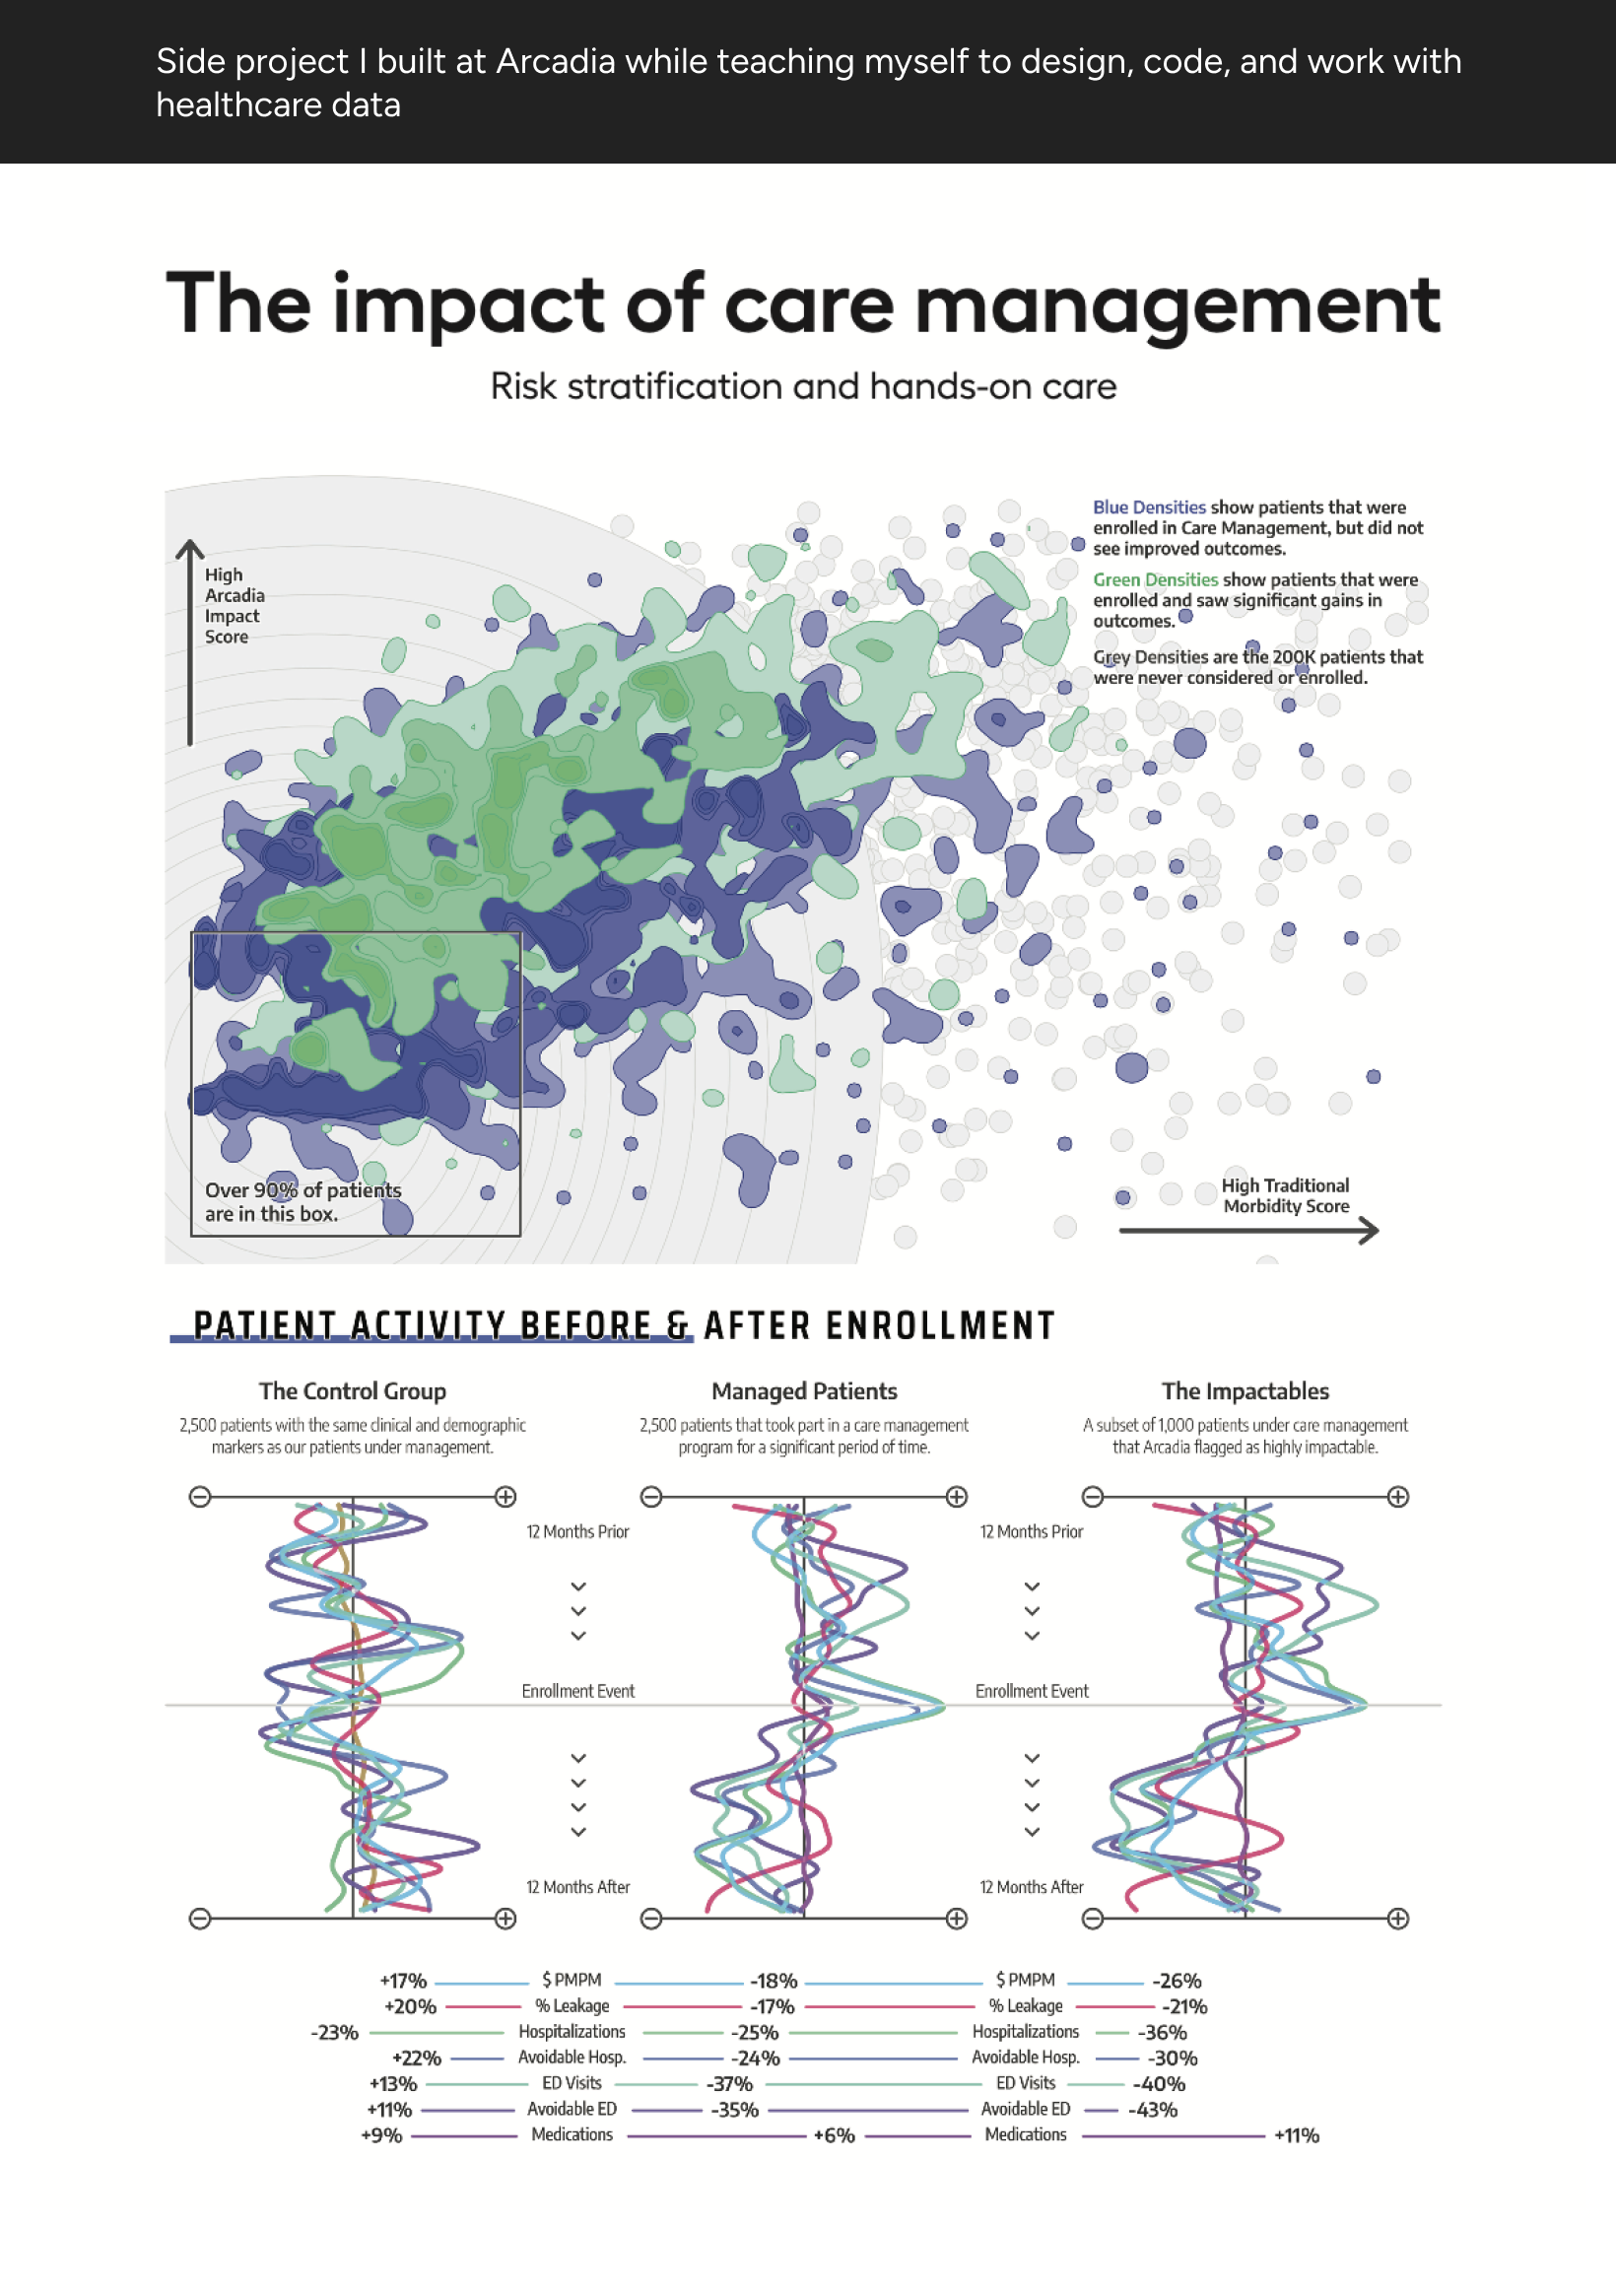
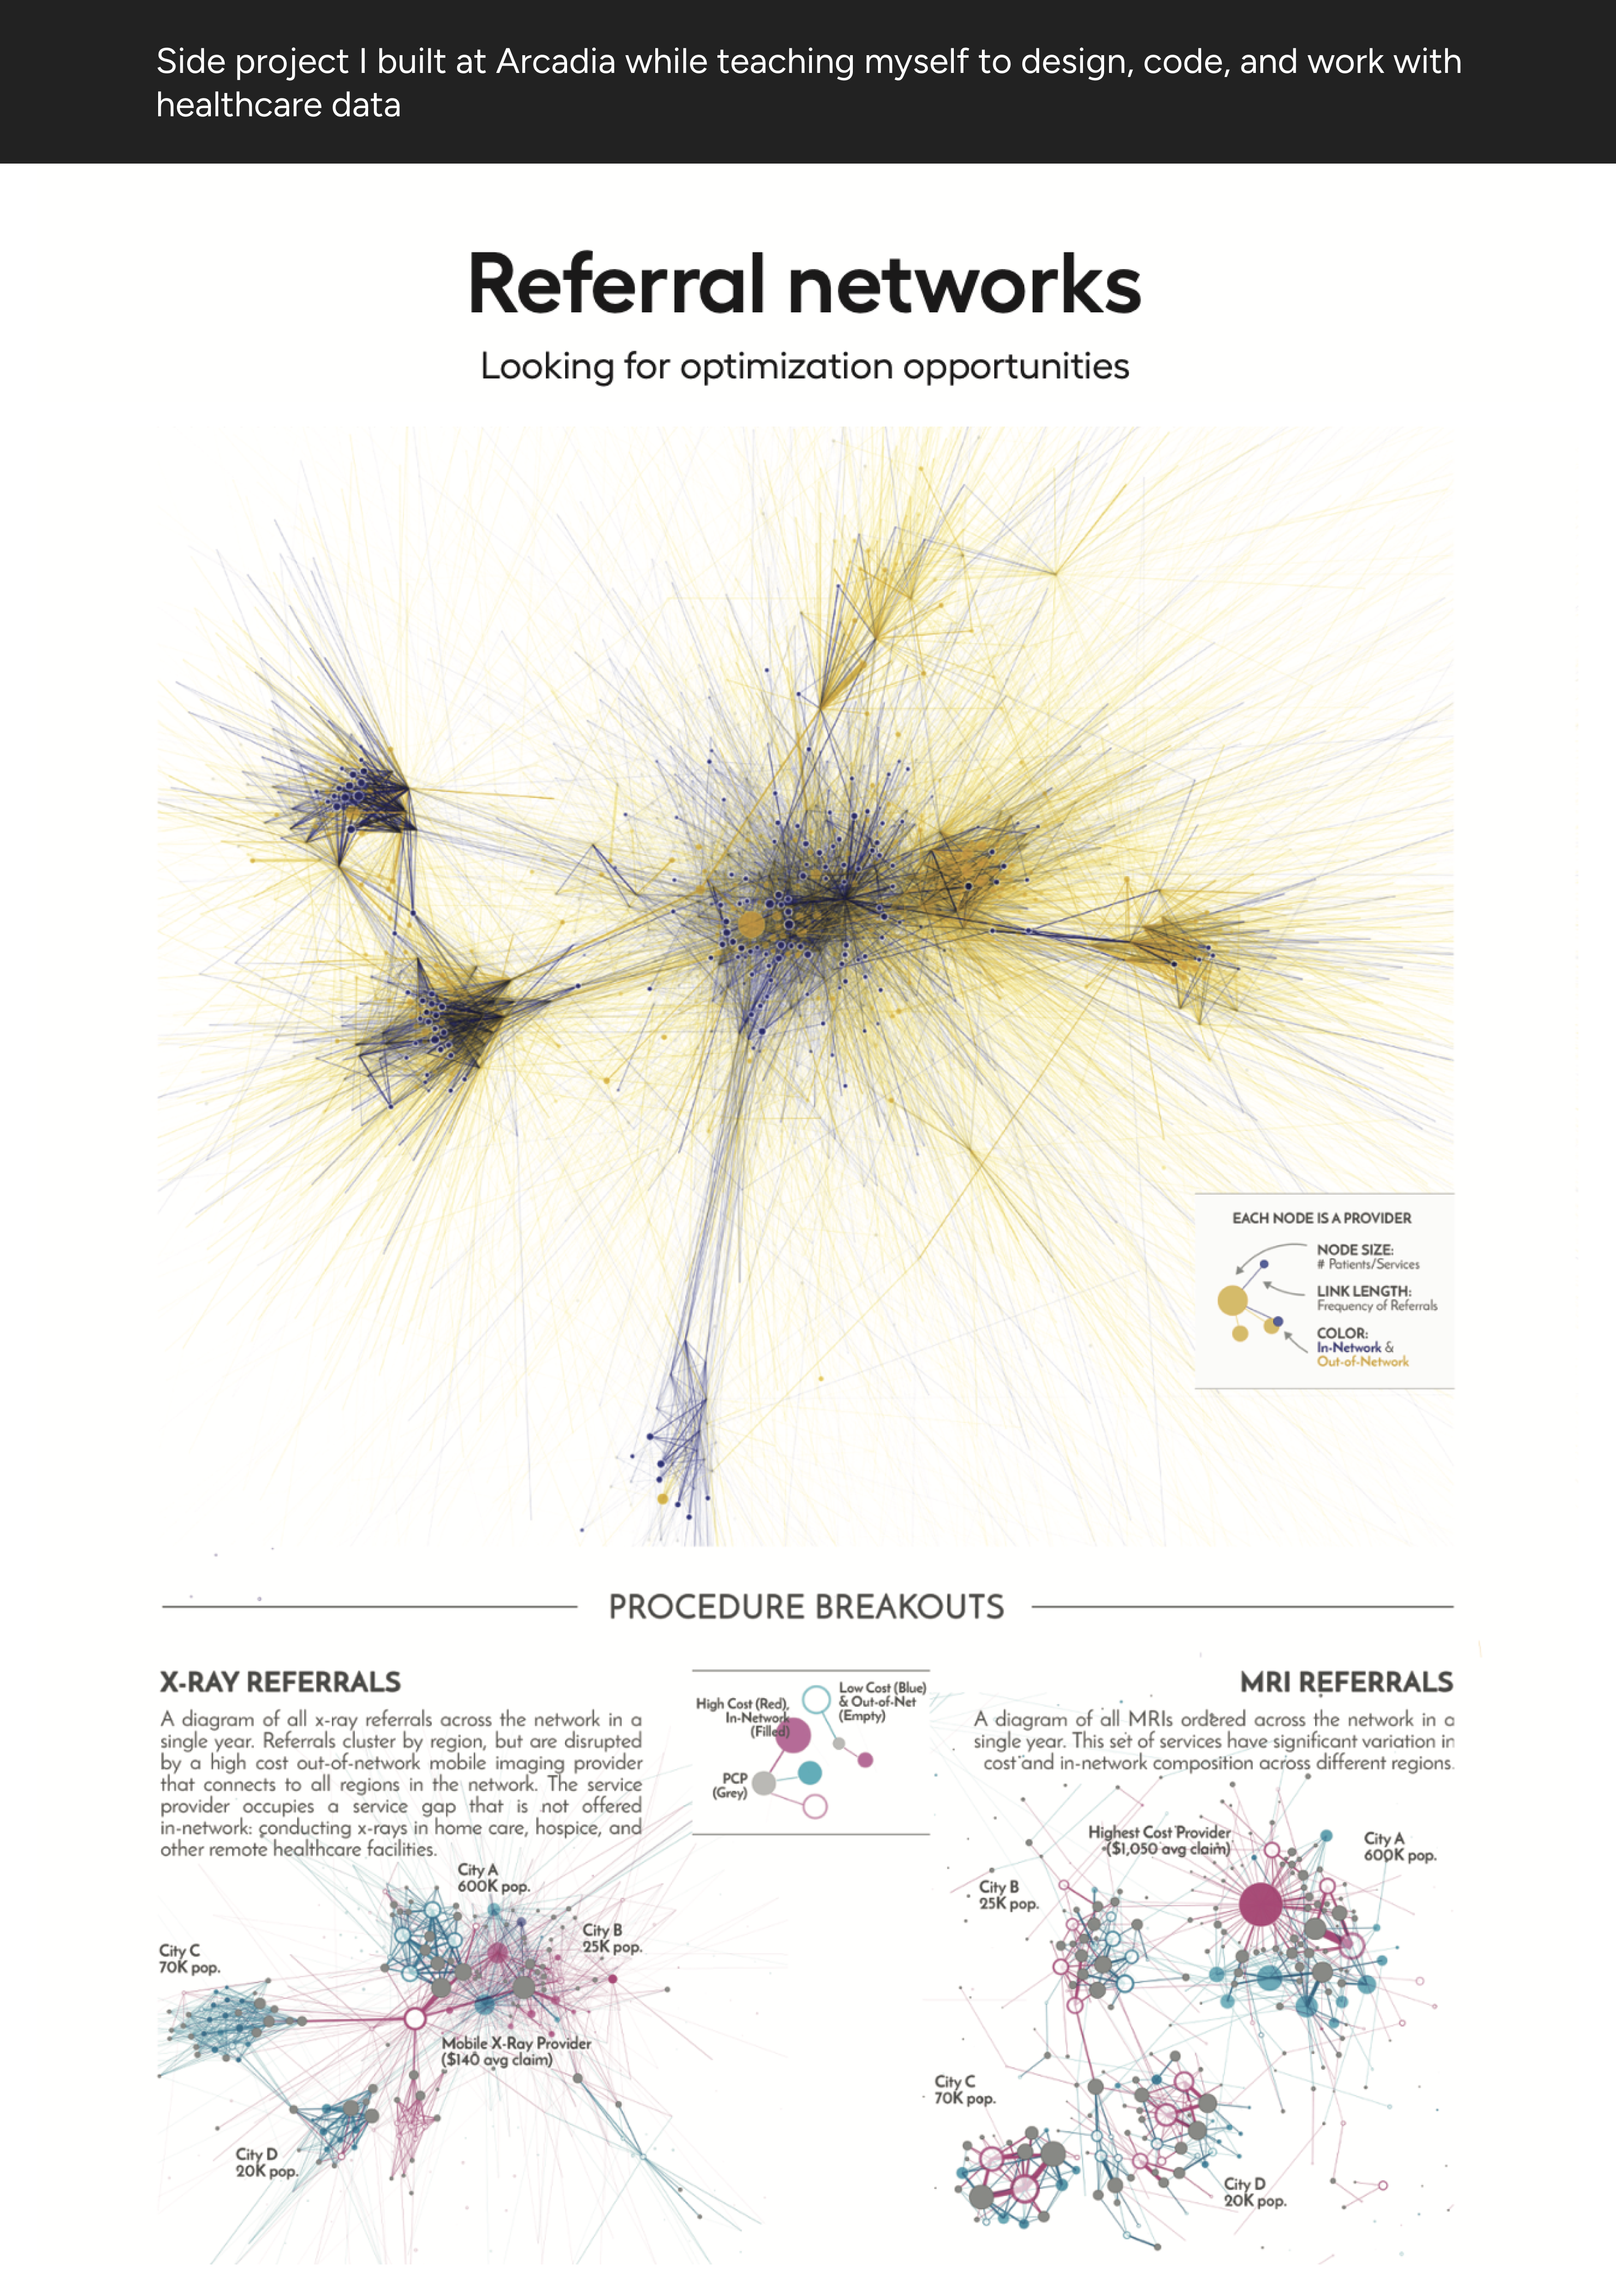
I started my career at Arcadia, a healthcare tech startup. I got my hands dirty, teaching myself to design, code, model data, and pitch new product ideas.
At Arcadia, I launched two enterprise workflow products from 0 to $XM: Care Manager and Referrals (press). It was fascinating to step into an unknown domain with the goal of encoding human judgment into systems. I translated the complex decisions trees that referral administrators work with into a deterministic product. In Care Manager, I worked to automate risk stratification and patient outreach, freeing nurses to focus on caring for patients. Both products went on to become core to Arcadia's suite.